
RustPBX Basics: Reports — Answering the Boss Without a Data Team
“So, how were calls this week?” — the question arrives weekly, and answering it should not require a data pipeline. RustPBX ships a reporting layer that reads your CDRs and answers in tables, charts, and CSVs, from both the console and an API.
The Console: Reports Page
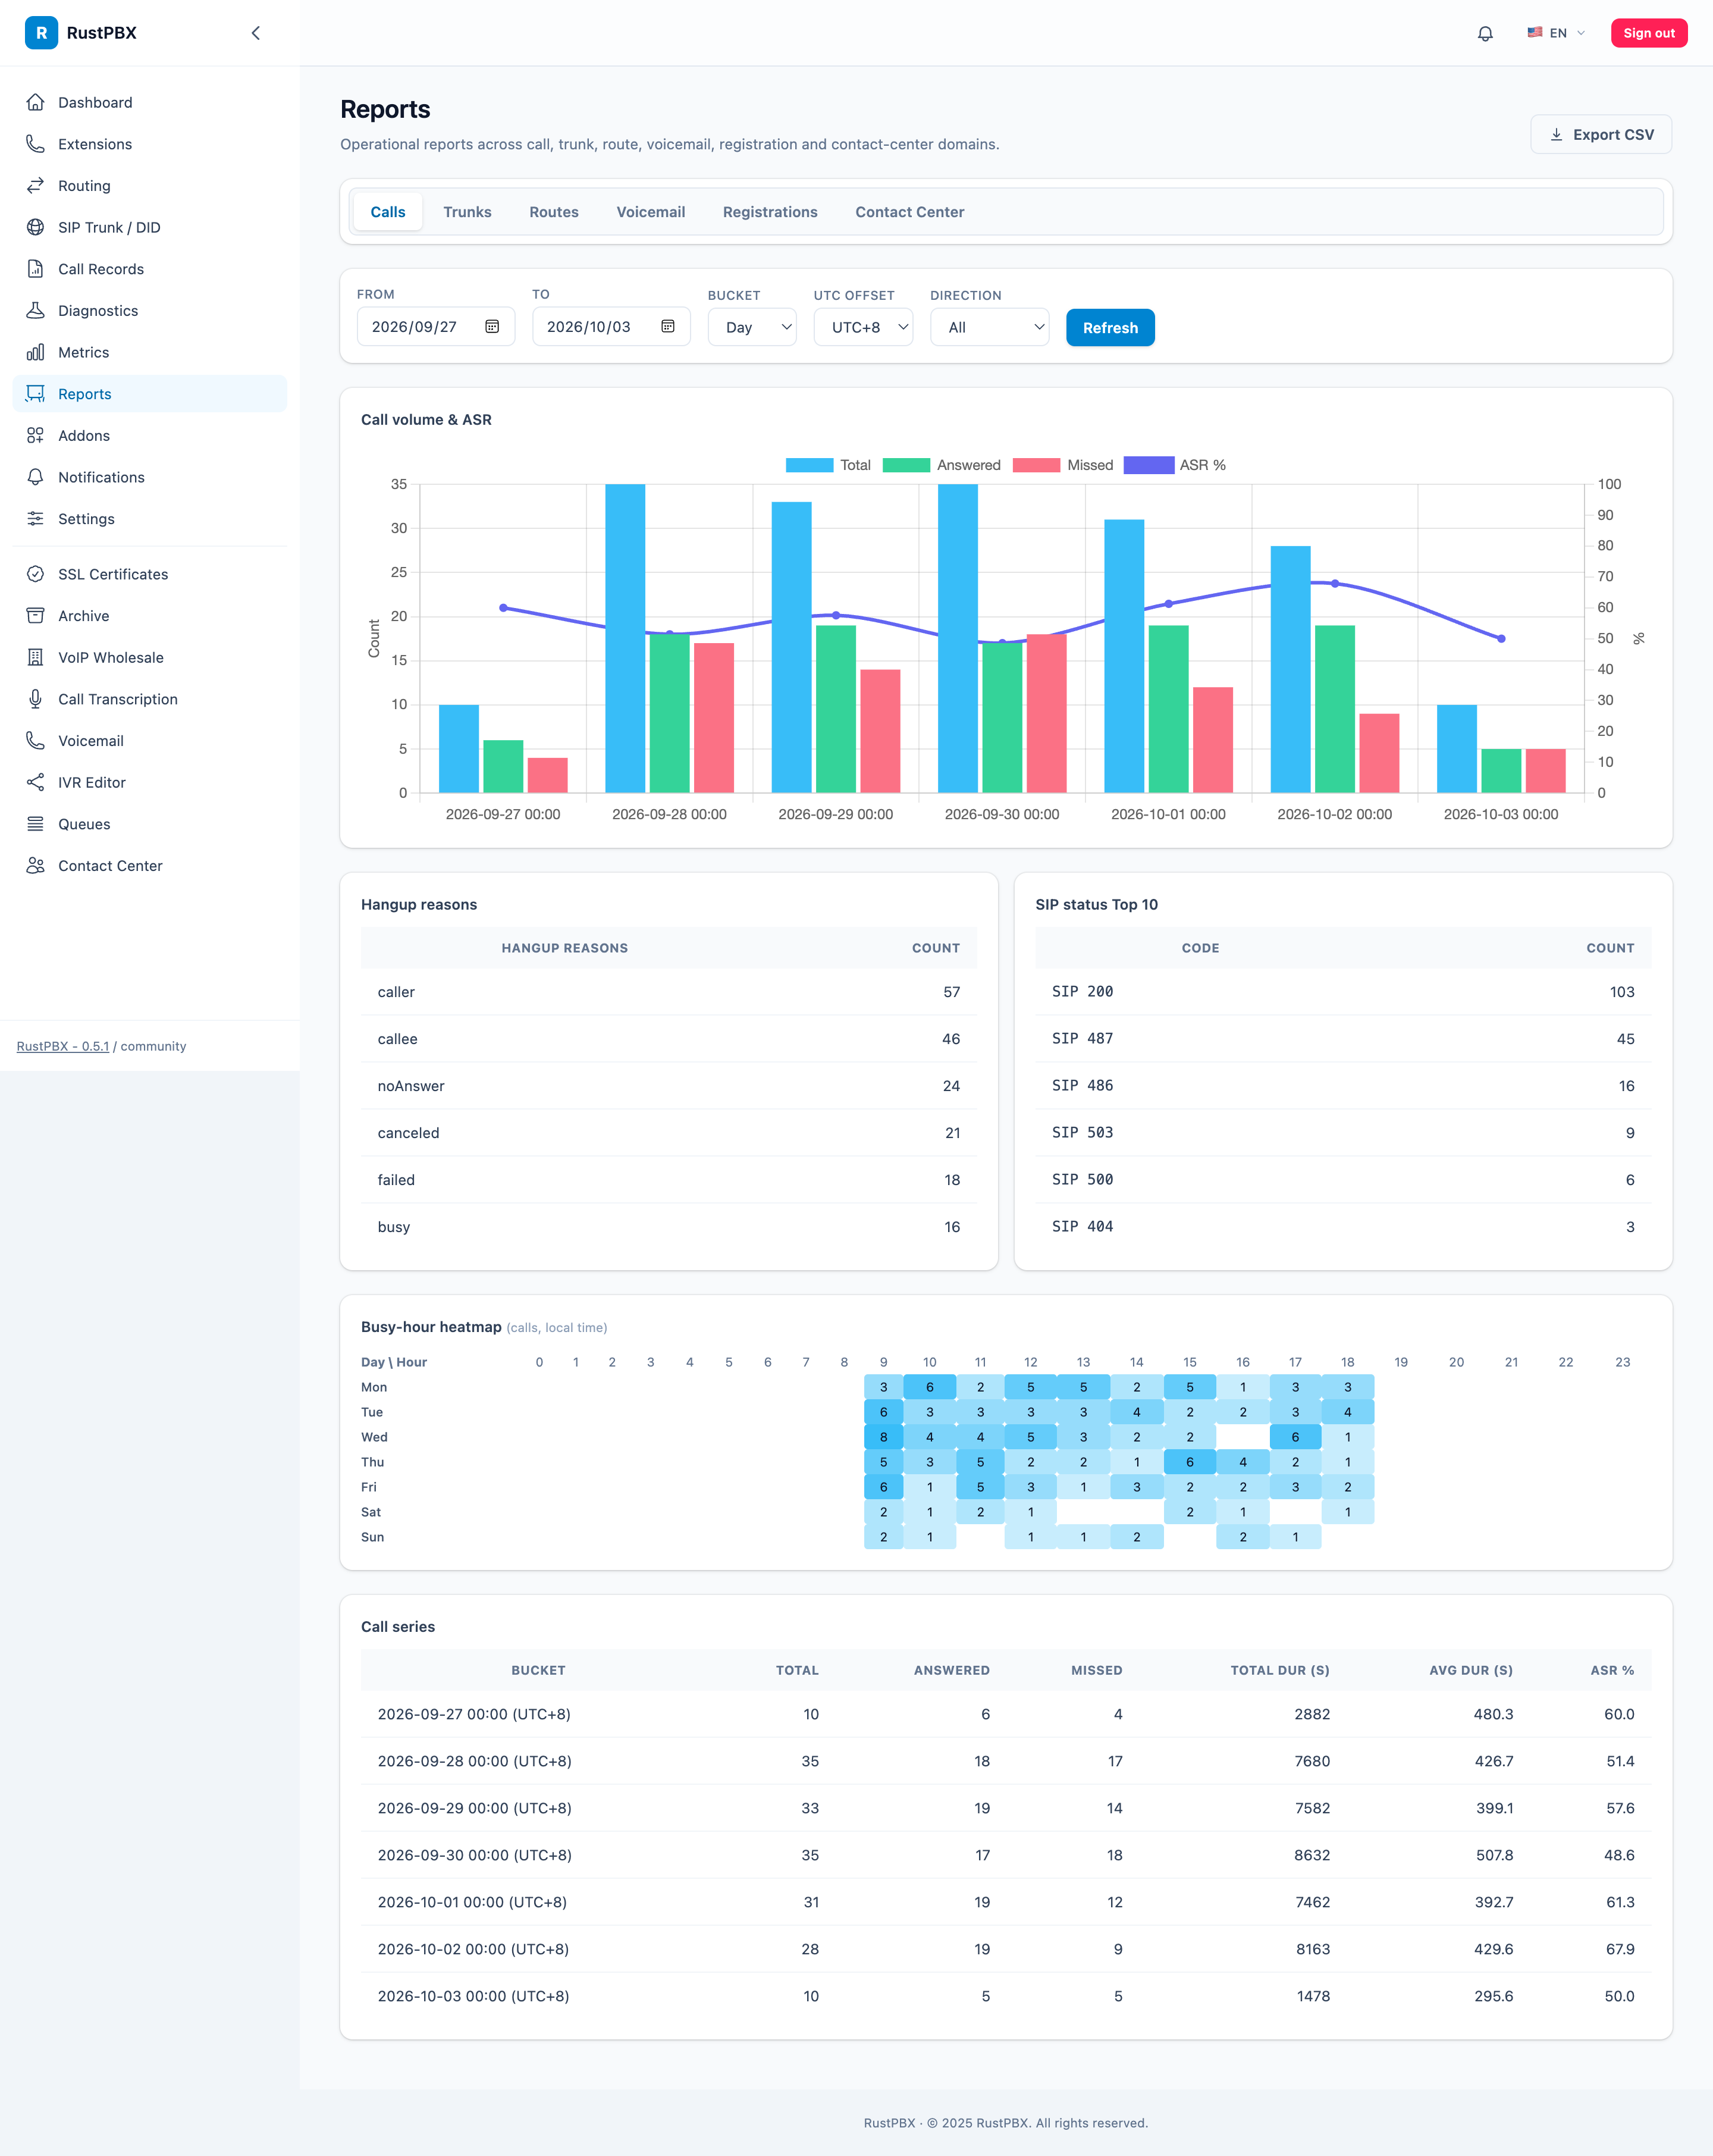
Console → Reports covers the daily questions out of the box:
- Call reports — volume, answer rate, duration, and failure breakdowns over any time range
- Trunk reports — per-carrier offered/answered/ASR, with heatmap views for spotting the hours where quality dips
- Domain reports — traffic sliced by routing domain
- Export — every view exports to CSV for the spreadsheet people
Under the hood it’s one API family — the unified multi-addon reporting layer — so CC, wholesale, and core PBX reports come from the same endpoints with the same auth.
The API: Same Answers, Programmatically
curl -H "Authorization: Bearer <token>" \
  "http://<host>:8080/api/reports/v2/call?from=2026-10-01&to=2026-10-07&bucket=day"

curl -H "Authorization: Bearer <token>" \
  "http://<host>:8080/api/reports/v2/trunk?from=2026-10-01&to=2026-10-07&bucket=hour"
Buckets (hour/day) return time series ready for Grafana or your own dashboards; the export siblings return CSV. Because CDRs carry route_id, session_id, trunk ids, and media quality, the aggregations are exact — route attribution is measured, not inferred.
A concrete question: “per-trunk ASR by hour, last 24h” — that’s the trunk endpoint with bucket=hour, grouped by trunk, with offered/answered in each row. The heatmap sibling (/reports/v2/trunk/heat) renders the same data as a matrix — carrier × hour — for spotting the 14:00 quality dip on one specific carrier.
Contact-Center Additions
The CC addon feeds the same layer with skill-group-first views: per-group SLA, status/alert/CSAT history, and snapshot deltas comparing this shift against baseline. Hourly stats tables power the charts, and group reloads are memory-only — reports keep flowing through config changes.
Dashboards Without a Data Team
The console’s dashboard covers the realtime picture (active calls, utilization, direction mix). For wallboards, point Grafana at /metrics (Prometheus format) or your alerting at the /reports/v2 endpoints — no ETL in between.
Guides: Reports in the docs and the Supervisor & Monitoring page.