Diagnostics Toolkit
The Diagnostics page and companion APIs concentrate reload workflows, routing simulations, registration introspection, and web-based test calls—this is the primary entrypoint for day-to-day troubleshooting.
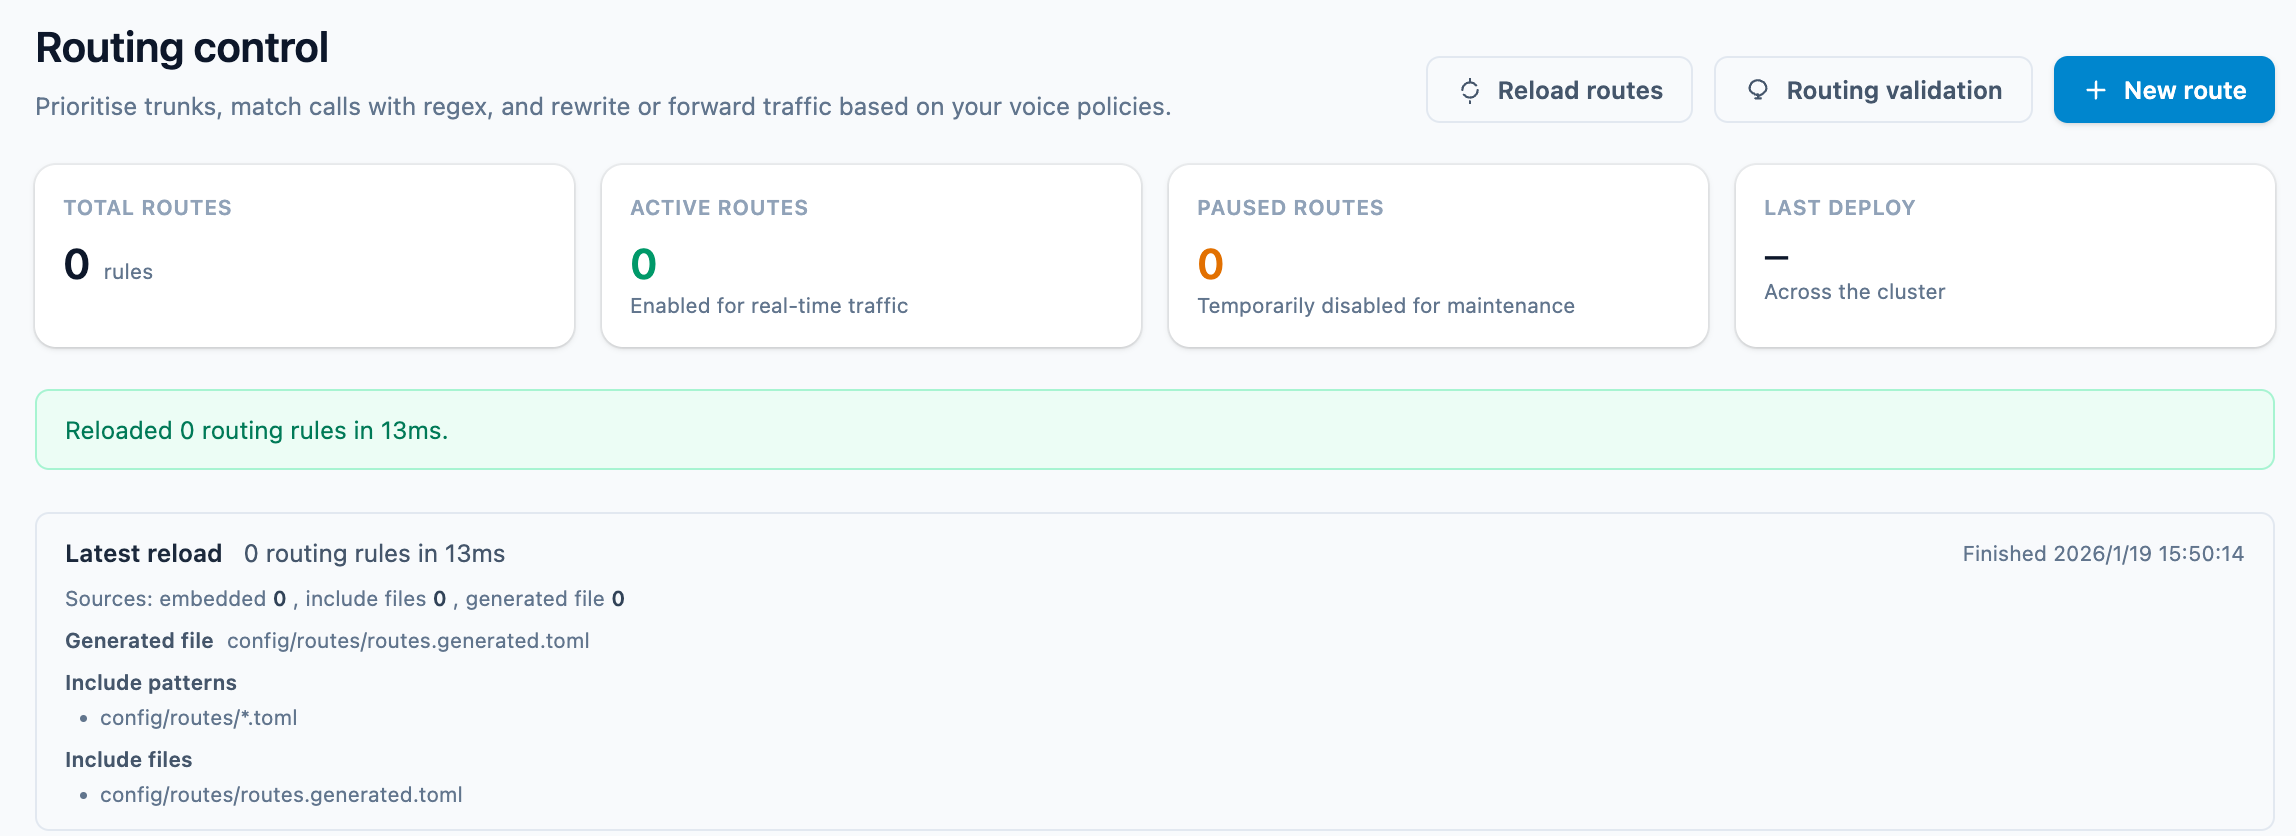
1. Reload & preflight checks
- How to trigger:
- UI:
Settings → Reload, with switches to reload Routing, ACL, or the full application. - API: management endpoints such as
/reload/acl,/reload/app, etc., suitable for scripted deployments.
- UI:
- Preflight logic:
preflight::validate_reloadblocks unsafe changes (removing the[console]section, deleting in-use trunks, ACL syntax errors). - Common hints:
Reload would disable the consolemeans[console]is missing inconfig.toml; trunk-related errors require restoring the trunk record in the database or TOML files.
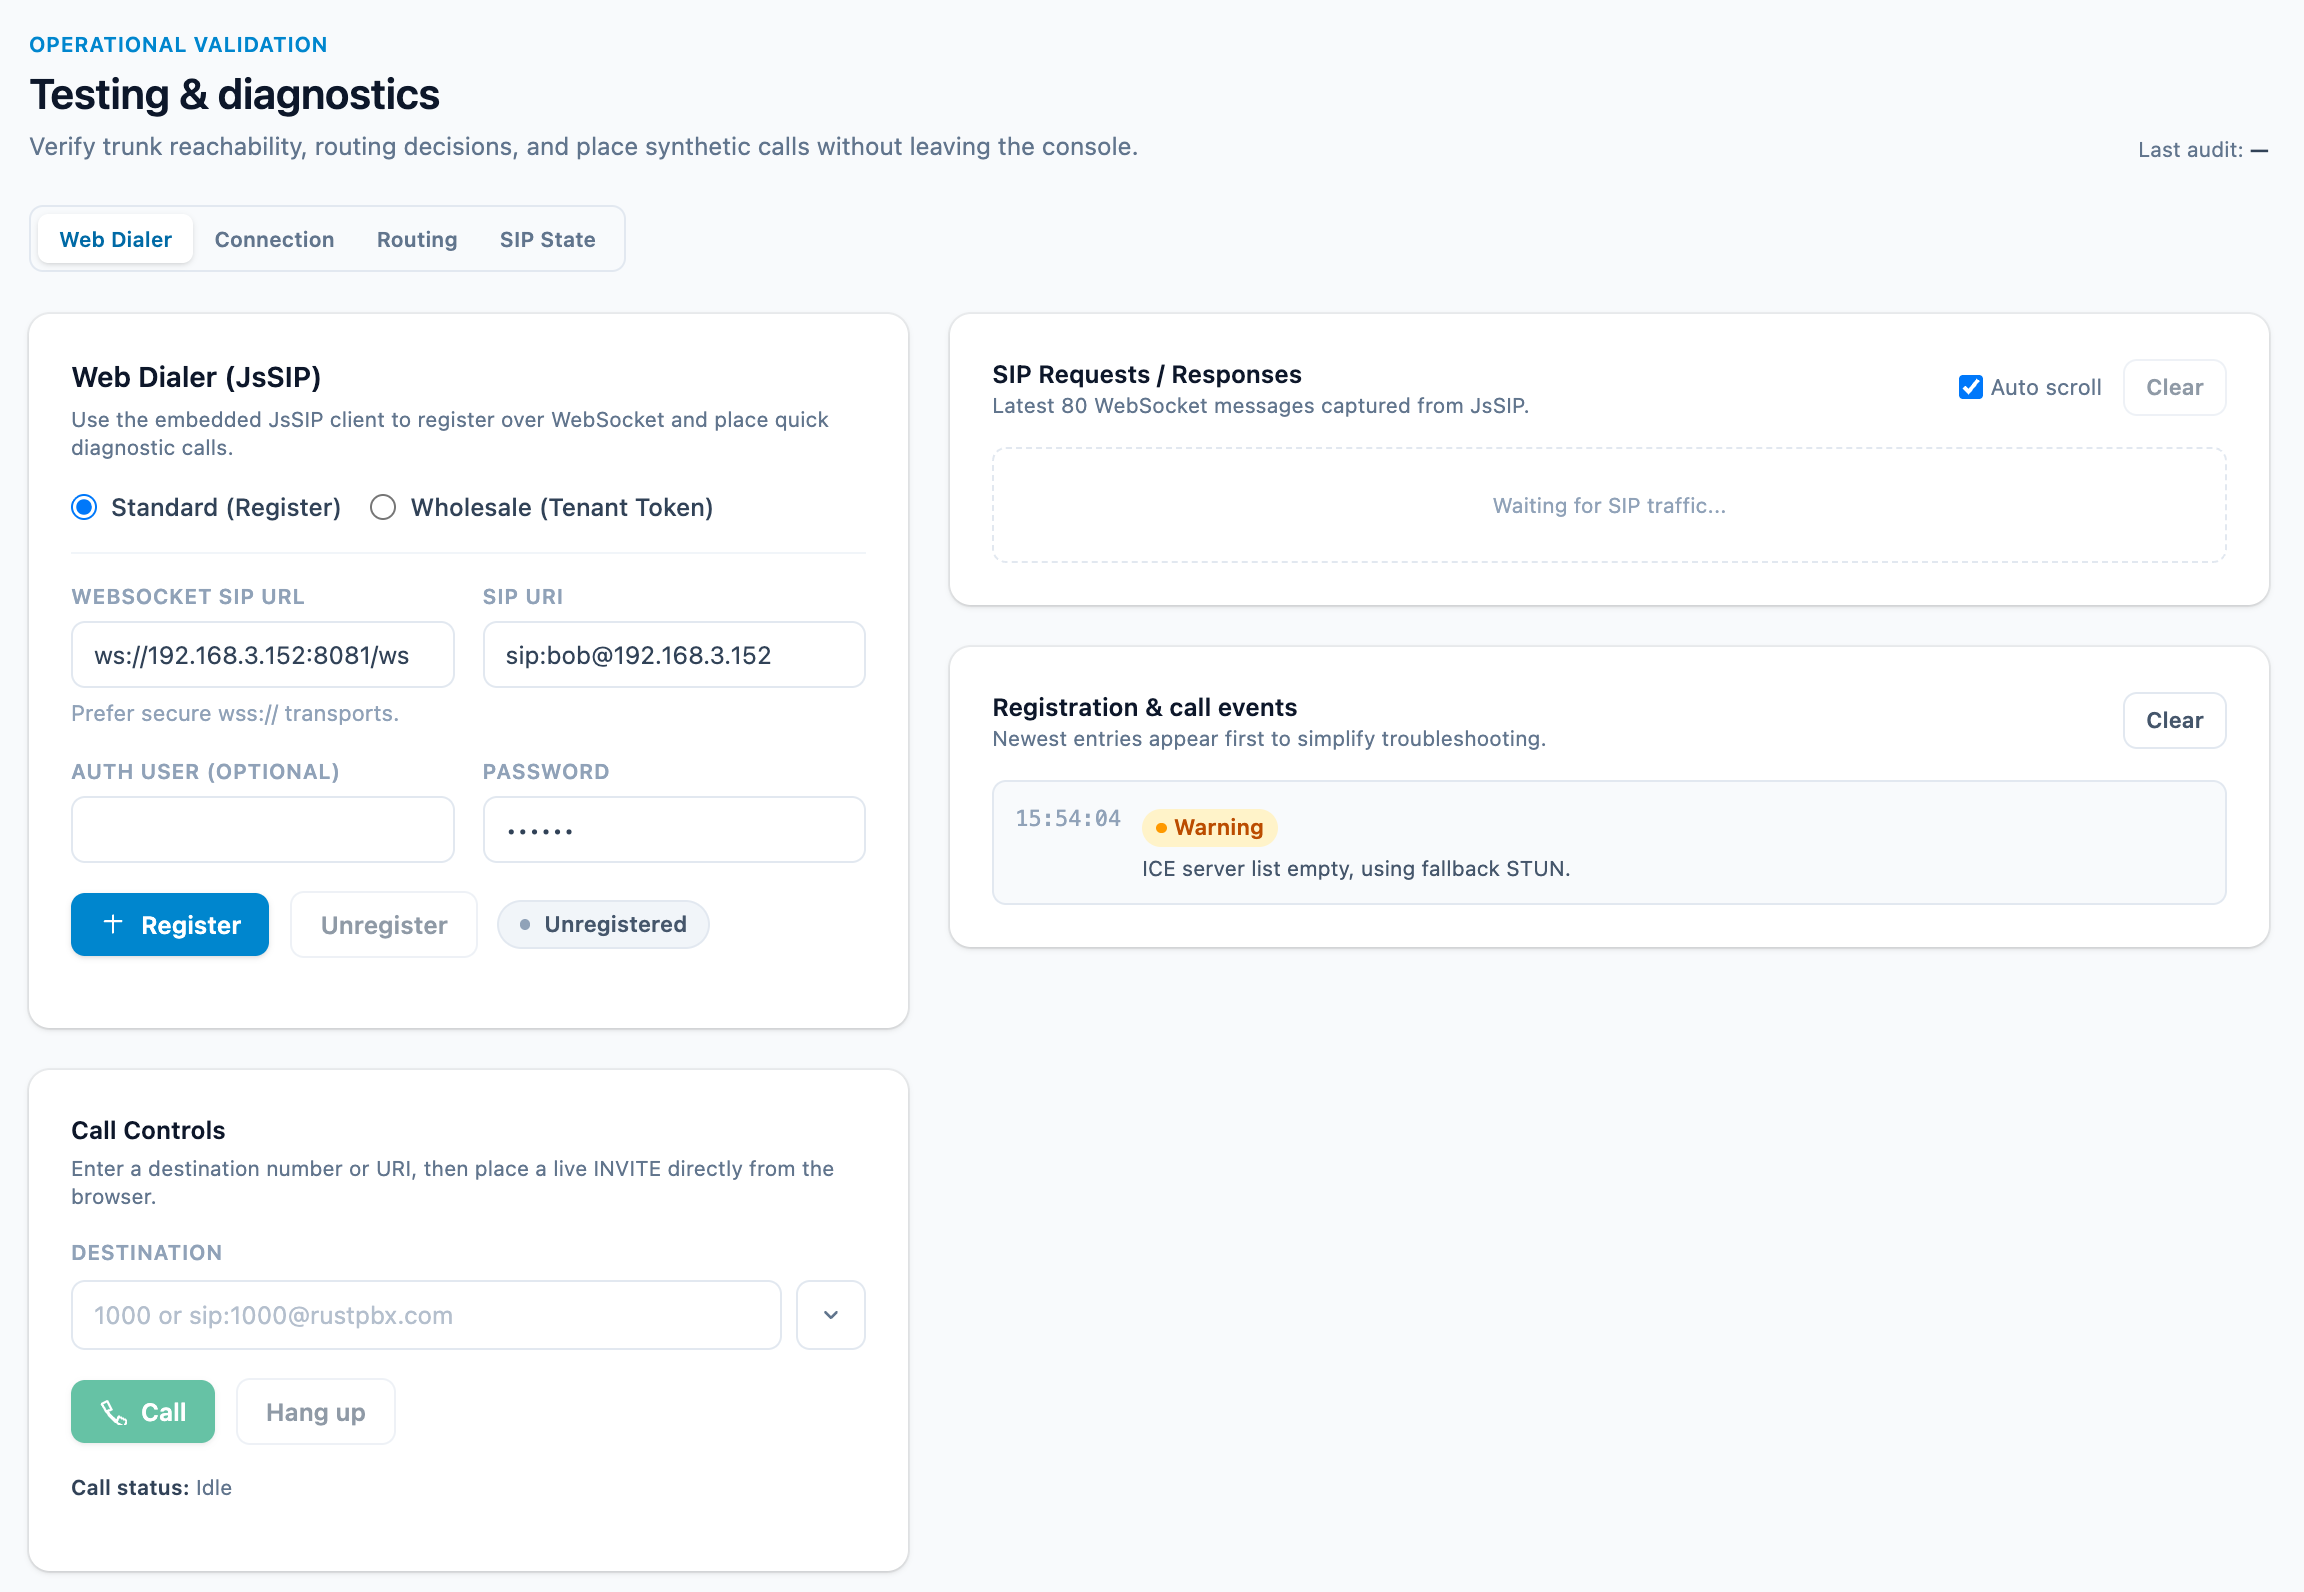
2. Reading the Diagnostics tabs
Implemented in templates/console/diagnostics.html, the page exposes multiple tabs:
- Connection: shows realm, enabled transports (UDP/TCP/TLS/WebSocket), sample credentials, plus a WebRTC ICE probe that validates
[ice_servers]entries. - Trunks: renders a runtime trunk snapshot.
/diagnostics/trunks/testverifies whether an IP or domain matchesinbound_hosts/destand sends carrier OPTIONS probes. - Routing:
/diagnostics/routes/evaluatesimulates rule matching forruntimeordatabasedatasets, returning the hit route, selected trunk, rewrite result, queue/IVR action, and optional abort code. - SIP:
- Active SIP dialogs: lists active INVITE dialogs and lets you inspect SDP offer/answer pairs.
- Locator registry:
/diagnostics/locator/*queries or removes bindings to debug registration issues.
- Web Dialer: embeds JsSIP so you can dial directly in the browser using the credentials from Connection; it captures the latest ~80 WebSocket frames for signaling analysis.
3. Logs, health checks, and external tooling
- Logging: configure
log_level,log_file, andlog_rotationinconfig.toml. File logs usetracing’s structured format with optional log rotation (hourly/daily). - Call records: the
callrecordmodule writes CDRs and recording URLs; the console’s Call Records view reads frommodels::call_recordfor reconciliation. - Health probe:
handler::amiexposes/health, reporting database, SIP core, and task runner status; load balancers orperfcli --pingcan consume it. - Traffic capture: no built-in packet capture button—run
sngrep,tcpdump, or reproduce scenarios via Web Dialer then capture RTP/SIP manually on the host. - Prometheus metrics:
GET /metricsexports Prometheus-format metrics including SIP registrations, dialogs, trunk call rates, RTP statistics, queue wait times, and system resources. - SipFlow query: query captured SIP/RTP flows via
GET /sipflow/flow/{call_id}(signaling) andGET /sipflow/media/{call_id}(media). The console’s SipFlow page provides a UI for browsing captured calls. - Frequency limits:
GET /frequency_limitslists active rate-limit blocks;DELETE /frequency_limitsclears them. Monitor for abnormal blocking patterns during incident response. - Trunk registrations:
GET /trunk_registrationsreturns the registration status of all outbound trunks, including expiry timers and last error codes.
4. AMI API reference
The diagnostic REST API is served under {ami_path} (default /ami/v1):
| Method | Path | Description |
|---|---|---|
GET | /health | Node health (version, uptime, active calls, task status, SipFlow stats) |
GET | /dialogs | List all active SIP dialogs with SDP details |
GET | /hangup/{id} | Force-hangup a specific dialog |
GET | /transactions | List running SIP transactions |
POST | /shutdown | Graceful shutdown |
POST | /reload/trunks | Reload SIP trunks from config |
POST | /reload/routes | Reload routing rules |
POST | /reload/acl | Reload ACL rules |
POST | /reload/app | Full application reload (with preflight validation) |
GET | /trunk_registrations | Get trunk registration statuses |
GET/DELETE | /frequency_limits | List or clear frequency limits |
GET | /sipflow/flow/{call_id} | Query SIP signaling flow for a call |
GET | /sipflow/media/{call_id} | Query RTP media flow for a call |
5. Typical troubleshooting paths
| Scenario | Playbook |
|---|---|
| Routing changes not effective | Settings → Reload → Diagnostics → Routing (Evaluate database & runtime) → inspect config/routes/*.toml |
| Registration failures | Diagnostics → SIP → Locator registry → confirm bindings → review proxy.acl_rules for blocked IPs |
| Inbound trunk rejected | Diagnostics → Trunks → test peer IP/domain → adjust inbound_hosts in config/trunks/*.toml if mismatched |
| One-way audio or media issues | Verify rtp_start_port/rtp_end_port exposure → reproduce via Web Dialer or a handset → capture RTP and inspect NAT/firewall |
| Billing or queue anomalies | Compare Call Records with billing templates → Diagnostics → Routing to confirm expected queue/route |
6. Automation & scripting
- Reload pipeline: CI jobs that modify
config/orconfig.tomlcan call/reload/acland/reload/app, parsing HTTP responses to ensure preflight success. - Health monitoring:
curl http://<host>:8080/health; alert or remove the instance ifstatus != ok. - Performance baselines:
examples/perfcli.rsperforms bulk registrations/calls; compare results with Diagnostics → Routing output to validate optimizations.
Mastering this trio—change, reload, validate—keeps incident loops within minutes and dramatically reduces carrier operations overhead.