
Observability Without an Observatory: Metrics, Traces and Call Evidence
Observability shouldn’t require standing up Prometheus, Grafana, and a log pipeline before you can answer “is it healthy?” — but it should scale to that when you’re ready. RustPBX takes both seriously, and 0.5 added the middle ground: useful telemetry with zero external dependencies.
Layer 1: The Local Stats Log (No Prometheus Needed)
Point stats_log at a file and the PBX writes one JSON line every stats_interval_secs — system + PBX summary for loss/load diagnostics:
stats_log = "/var/log/rustpbx.stats.log"
stats_interval = 5
A single small node gets time-series data, jq-able for quick analysis, without operating a metrics stack. It’s also the fastest way to answer “was the box overloaded during that incident?”
Layer 2: Prometheus / OpenTelemetry
When you’re ready to centralize, the surfaces are already there:
GET /metrics— Prometheus-format counters and histograms: SIP registrations, active dialogs, trunk calls/failures/latency, RTP packet stats, queue wait times, system resources.- Telemetry addon — OpenTelemetry distributed tracing plus health checks, for teams standardizing on OTel.
- Process-wide telemetry — media/SIP telemetry is collected platform-wide (not per-addon), so media metrics don’t disappear when an addon is disabled.
Layer 3: Call-Level Evidence
Aggregate metrics tell you that something is wrong; the call record tells you why. Every CDR carries:
| Evidence | Answers |
|---|---|
| Leg timeline | Ring/answer/hold/transfer timing per leg |
| Matched route (id + name) | Which rule served the call |
sip_status_code + hangup_reason | How it ended, normalized |
| RTCP media quality | Loss %, jitter, RTT per trunk leg |
proxy.leg_media_incomplete | Silent leg that never carried media |
call_error catalog entry | Unified error reference for call-affecting failures |
The console’s record-detail page renders the call trace timeline next to the error reference — “why did this call fail” becomes a lookup, not a Wireshark session.
Layer 4: Signaling Forensics
For anything the CDR can’t explain, SipFlow captures the complete SIP/RTP ladder — queryable per call_id, with media replay into WAV. See SipFlow at scale.
Layer 5: Live Event Streams
The RWI event bus emits call, queue, and agent events with metrics on event volume; the webhook runtime adds retry, idempotency, and queue-latency metrics. Feed a NOC, a CRM, or an alerting pipeline.
The Right Order
- Start with
stats_log+/metrics(targets + blackbox). - Add per-call evidence in your alert runbook (route, media, error).
- Then centralize: Prometheus or OTel, SipFlow for capture, webhooks for automation.
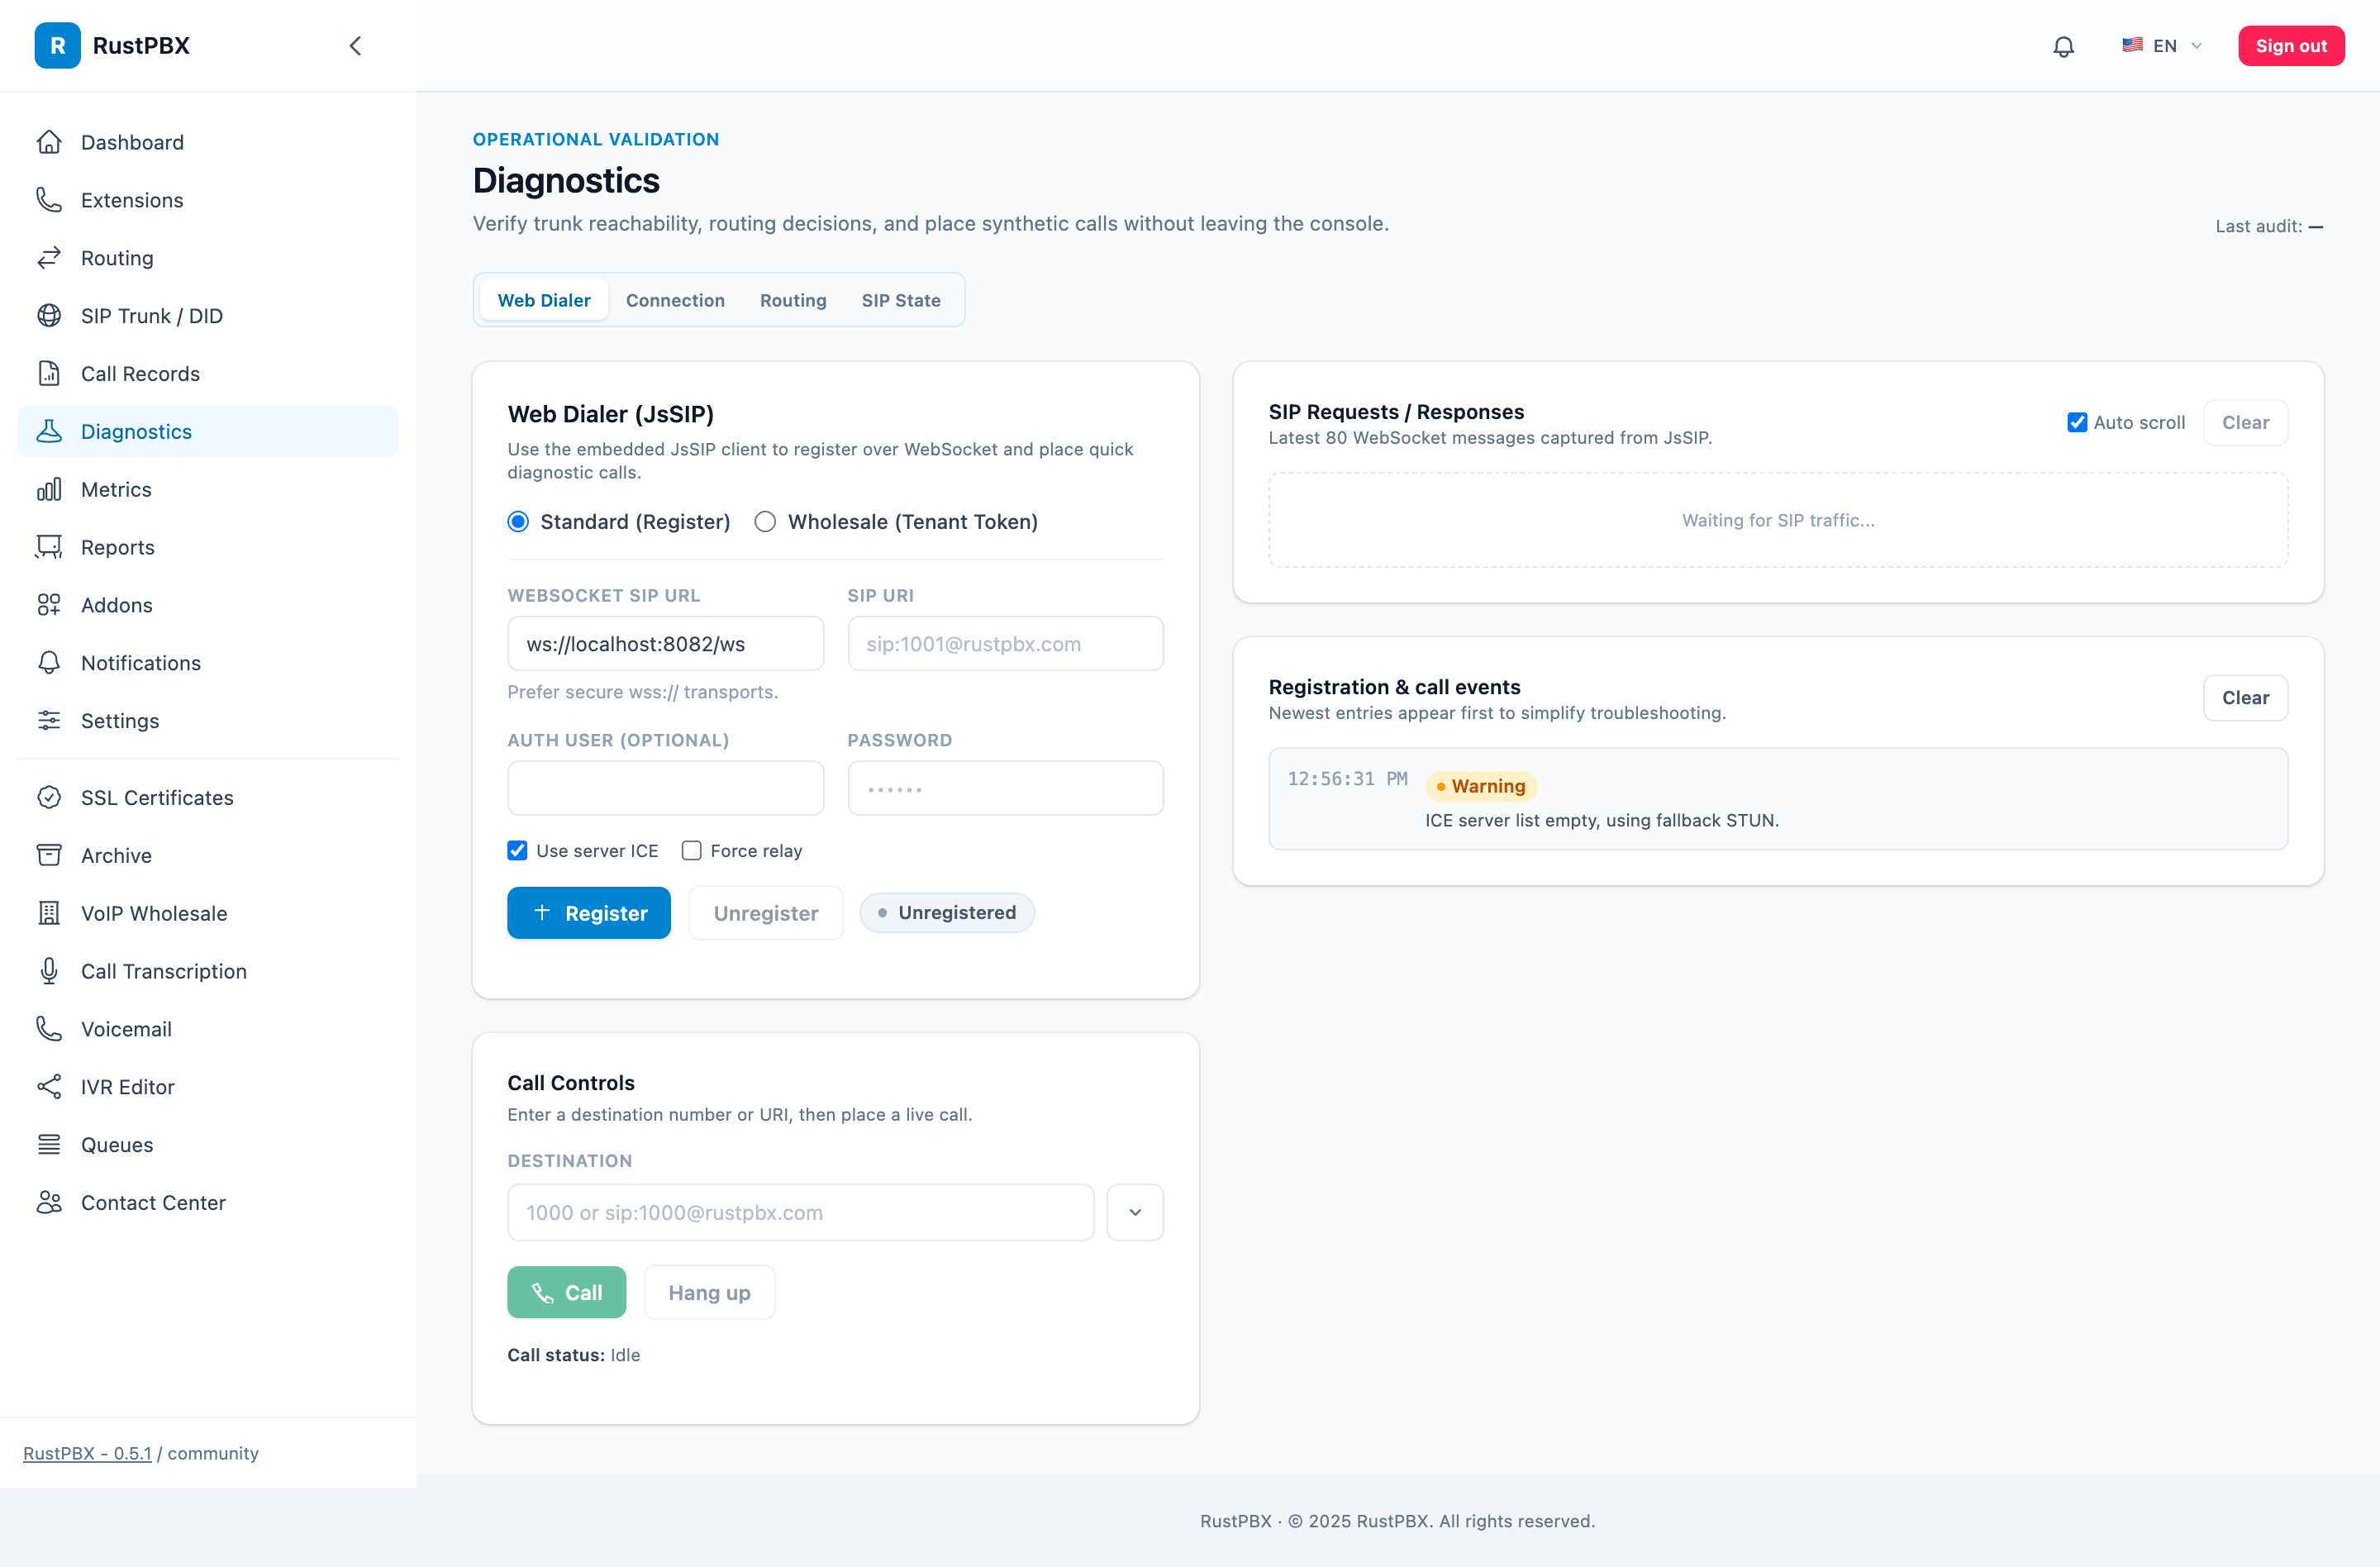
Guides: Diagnostics and the Telemetry addon.