
Why Rust for Voice: Performance You Can Plan Capacity Around
Performance posts usually end in a benchmark table nobody can reproduce. This one is about something more useful: the shape of the performance, so you can plan capacity without surprises — and know where the real limits are.
The Architecture in One Paragraph
RustPBX runs SIP signaling, the media plane, call records, billing, and the web console in one async Rust runtime. No sidecar processes, no queues between “the proxy” and “the media server”, no IPC hops on the call path. A SIP message that arrives is routed, authenticated, and answered by code in the same process — and media relay runs as generated packet transformations, not per-call threads.
The Numbers That Matter
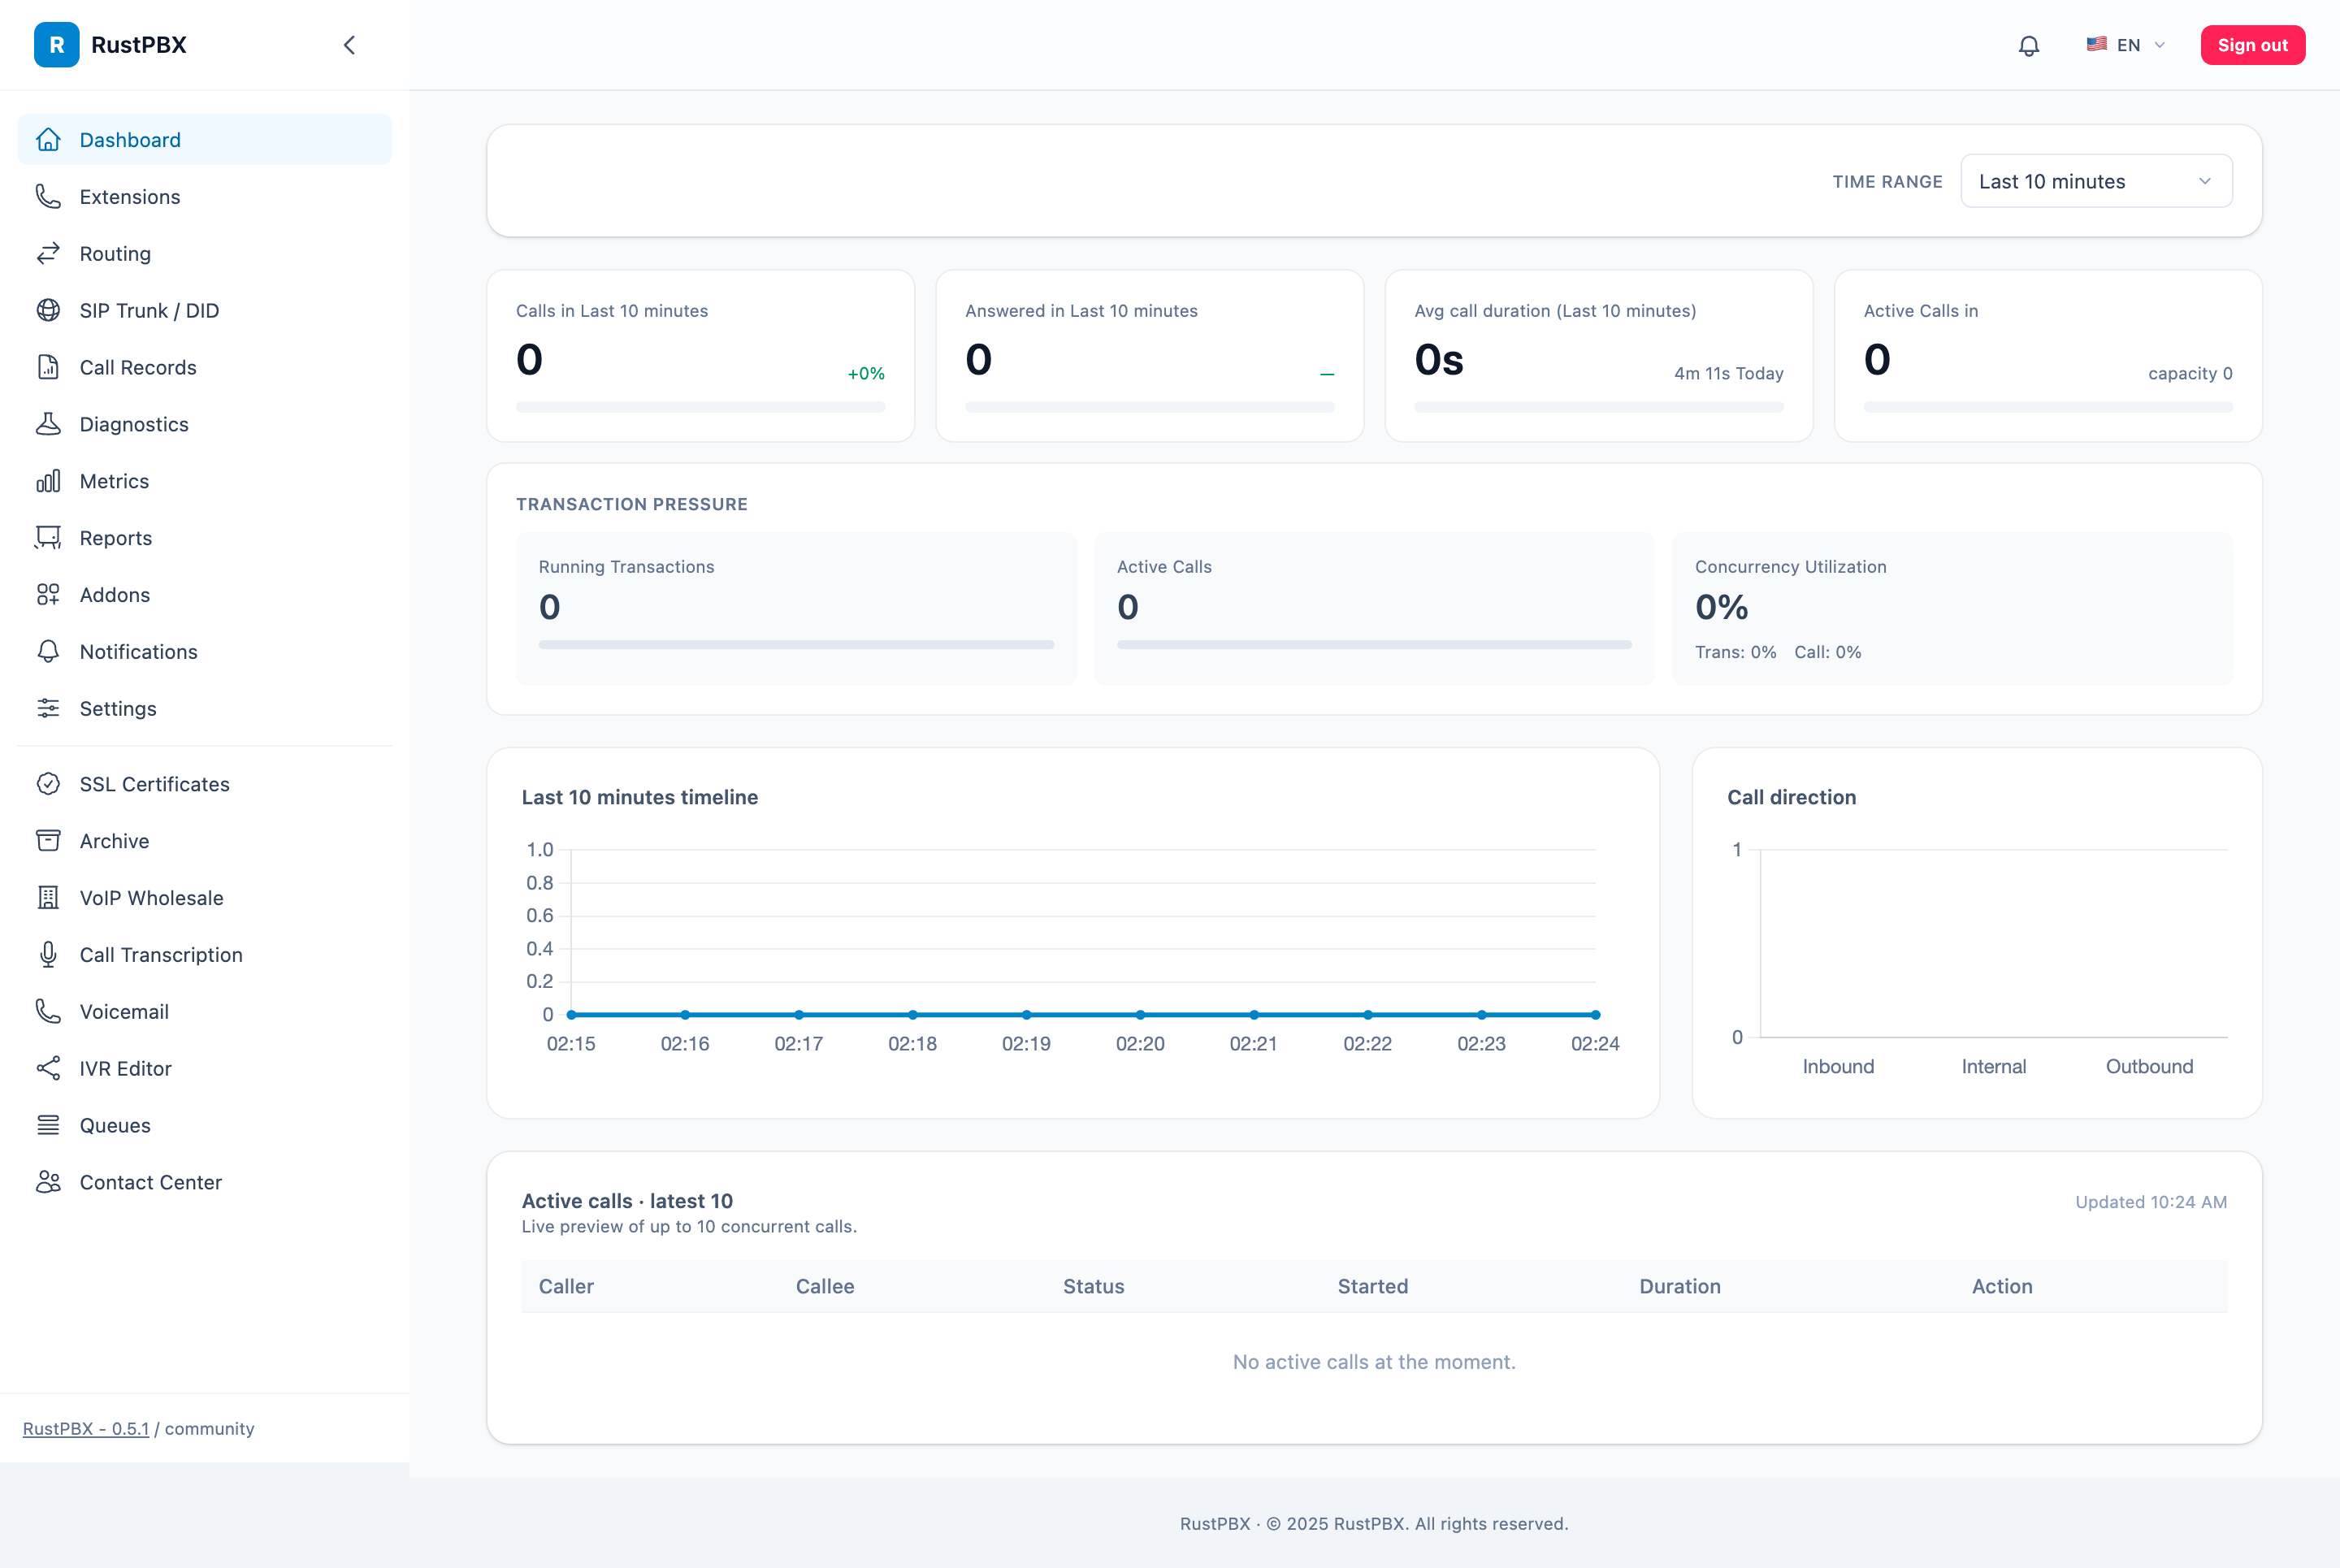
On a 4 vCPU / 8 GB node with SRTP enabled, the planning envelope is:
| Metric | Range | Notes |
|---|---|---|
| Concurrent calls | 500–800 per node | Varies with codec and recording strategy |
| Calls per second | 30+ CPS | Lightweight scenarios; carrier throttling is usually the limit |
| Internal processing latency | < 20 ms | End-to-end latency follows the network |
| Media CPU per call | ~1/5–1/8 of a vCPU | SRTP relay is the primary consumer |
The important phrase is “per node” — capacity adds horizontally, see the cluster post.
Where the CPU Actually Goes
- SRTP encryption — the main cost; it’s per-packet crypto at line rate.
- Transcoding — avoided entirely when both legs share a codec. RustPBX relays same-codec transport combinations on a fast path; only genuinely different codecs enter the transcode path.
- Recording — writes are buffered and uploaded asynchronously; a slow storage backend doesn’t back-pressure the call.
- Everything else — signaling is cheap. Thousands of registrations and dozens of CPS barely register next to media.
This is why “500–800 calls” is a range: a node relaying G.711 with no recording lands near the top; one transcoding Opus↔G.729 with stereo recording lands lower. Plan with your actual profile.
Measuring Your Own Workload
Two built-in tools:
examples/perfcli.rs— bulk registrations and call setup for load generation.cargo bench— microbenchmarks for the hot paths.
For production telemetry, /metrics exports live counters (calls, RTP stats, queue waits, system resources) and the local stats log writes a JSON summary every interval — no Prometheus required.
Failure Behavior Is Part of Performance
Throughput numbers describe the happy path. The interesting question is what happens under stress:
- Back-pressure is bounded — SipFlow has bounded queues with per-IP loss reporting instead of unbounded memory growth.
- Reload waits for the port — the core waits for the SIP listener to release before rebinding, so a reload can’t burn its retry budget against a draining socket.
- Buffer pooling — media paths recycle buffers; the async runtime is configured with headroom for debug builds and originated calls.
Capacity Planning Cheat Sheet
- Start from concurrent calls and average call duration → Erlangs.
- Apply a 70% utilization target for headroom.
- Add ~20% for recording, more if transcode-heavy.
- Add Cluster/SipFlow peers as separate nodes.
- Validate with
perfcliin staging with production codecs and recording on.
The point of Rust here isn’t winning a synthetic benchmark. It’s that the performance is predictable: no GC pauses to explain at 2 AM, no thread-per-call cliff at 500, no mystery latency when the DB slows down. Details in Technical Specs.